Handsontable
Handsontable has relicensed away from open source!
The original MIT license still applies to version 6.2.2.
After adding the new licenseKey requirement, basic integrations still work
with version 17.1.0.
Handsontable is a robust JavaScript data grid.
The following live integrations use the standalone build:
This demo was tested in the following environments:
| Browser | Date |
|---|---|
| Chromium 148 | 2026-06-09 |
| Safari 18.2 | 2026-06-09 |
This demo barely scratches the surface. The underlying grid component includes many additional features that work with SheetJS Pro.
Integration Details
The "Frameworks" section covers installation with Yarn and other package managers.
Using the npm tool, the following command installs SheetJS and Handsontable:
npm i --save https://cdn.sheetjs.com/xlsx-0.20.3/xlsx-0.20.3.tgz handsontable@6.2.2
Methods and components in both libraries can be loaded in pages using import:
import { read, utils, writeFile } from 'xlsx';
import Handsontable from 'handsontable';
import 'handsontable/dist/handsontable.css'
Official framework wrapper packages (e.g. @handsontable/react-wrapper) should
be used in greenfield projects, as they encapsulate best practices.
Due to framework volatility, the pre-baked integrations may not work with older versions of ReactJS.
Internal State
Handsontable uses arrays of arrays under the hood by default. This is the most flexible approach for processing arbitrary data.
If a schema is passed when the table is constructed, Handsontable will use arrays of objects instead1.
Reading Data
The SheetJS read function processes file data and
returns a workbook object. After selecting a worksheet, the
sheet_to_json method can return an
array of arrays or array of objects.
The result of sheet_to_json can be passed directly to the loadData method2
of a Handsontable instance.
The following snippet fetches a file, extracts data from the first worksheet, and passes the data to the grid:
import { read, utils } from 'xlsx';
import Handsontable from 'handsontable';

/* `hot` is assumed to be the Handsontable instance */
// const hot = new Handsontable(/* ... */);

async function fetch_and_view_first_sheet() {
  /* fetch and parse https://docs.sheetjs.com/pres.numbers */
  const file = await (await fetch("https://docs.sheetjs.com/pres.numbers")).arrayBuffer();
  const wb = read(file);

  /* Generate an array of arrays from the first worksheet */
  const first_sheet = wb.Sheets[wb.SheetNames[0]];
  const aoa = utils.sheet_to_json(first_sheet, { header: 1 });

  /* load data into Handsontable instance */
  hot.loadData(aoa);
}
Writing Data
The getData method3 of a Handsontable instance returns the current data. By
default, the method returns an array of arrays.
The SheetJS aoa_to_sheet
method generates a worksheet object from the data. After creating a new workbook
with book_new, writeFile
The following snippet pulls data from the grid and exports to SheetJSHOT.xlsx:
import { utils, writeFile } from 'xlsx';
import Handsontable from 'handsontable';

function export_data_to_xlsx(hot) {
  /* pull data from the Handsontable instance */
  const aoa = hot.getData();

  /* generate a SheetJS worksheet object */
  const ws = utils.aoa_to_sheet(aoa);

  /* generate a single-sheet workbook and export to SheetJSHOT.xlsx */
  const wb = utils.book_new(ws, "Exported Data");
  writeFile(wb, "SheetJSHOT.xlsx");
}
For framework-native state management, the recommended approach is to listen for grid events and explicitly update a separate copy of the data4.
Demo
This sample ReactJS-powered site uses SheetJS and Handsontable to display data from a sample NUMBERS spreadsheet and export data to a new file.
- Create a new project from the ViteJS
react-tstemplate:
npm create vite@latest -- sheetjs-hot --template react-ts --no-interactive
cd sheetjs-hot
npm i
- Install SheetJS and Handsontable libraries:
npm i --save https://cdn.sheetjs.com/xlsx-0.20.3/xlsx-0.20.3.tgz handsontable@6.2.2
- Start the dev server:
npm run dev
The terminal window will display a URL (typically http://localhost:5173).
Open the URL with a web browser and confirm that a page loads.
- Download
App.tsxand replacesrc/App.tsx:
curl -L -o src/App.tsx https://docs.sheetjs.com/handsontable/App.tsx
Testing
- Refresh the browser window. A grid and two buttons should be visible:
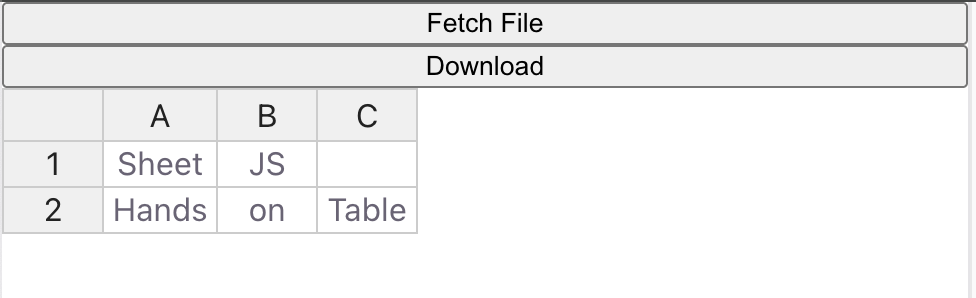
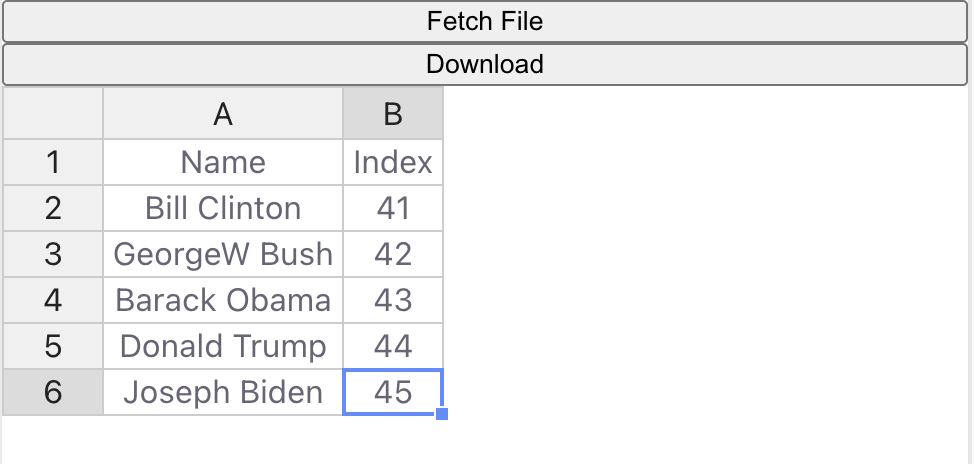
- Press the "Fetch File" button. The grid will refresh with Presidential data:

- Make some changes to the grid data.
Some statisticians believe President Grover Cleveland should be counted once. That would imply President Clinton should be index 41 and the indices of the other presidents should be decremented.
Double-click on each cell in the Index column and decrement each value. The new values should be 41, 42, 43, 44, and 45, as shown in the screenshot below:
- Click on the "Download" button. The browser should attempt to download a new
spreadsheet (
SheetJSHOT.xlsx). Save the file.
Open the generated file and verify the contents match the grid.
Footnotes
-
See "Array of Objects" in the "Data management" section of the Handsontable documentation for more details. ↩
-
See
loadDatain the Handsontable API documentation for more details. ↩ -
See
getDatain the Handsontable API documentation for more details. ↩ -
See "Events and hooks" in the "Data management" section of the Handsontable documentation for more details. ↩